In our fourth instalment of our Workthere Flexmark report we surveyed flexible office providers across the globe to determine the current state of play in the flex market. We explore occupancy levels, who is using flex space, what customers want from flex, what the future looks like for the sector and how flex operators are approaching ESG strategy.
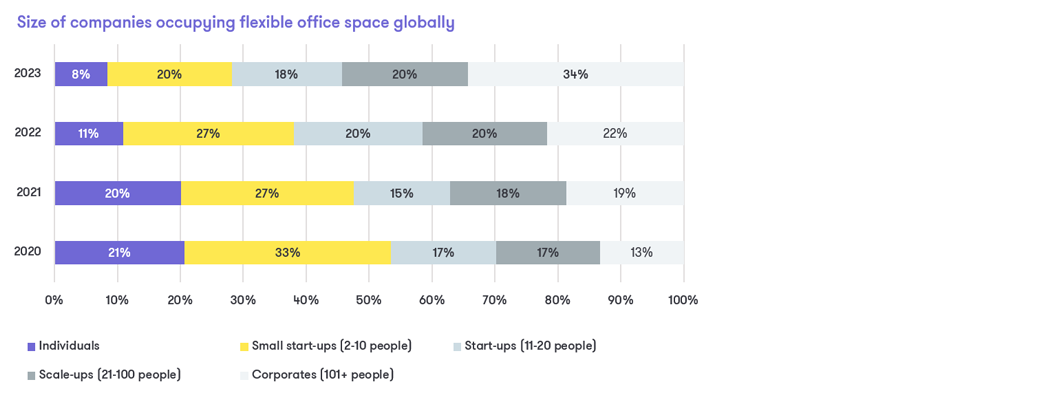
Our research revealed that we continue to see larger businesses take more flexible workspace. Larger companies (101+ people) now account for 34% of global take-up in flexible offices, compared to 22% in 2022 and just 13% in 2020. Together, larger companies and scale ups (21-100 people) now account for 54% of global flexible office members, compared with 42% of members last year.
Occupancy (by contract) levels have remained stable over the last 12 months for both private offices and shared offices. Private office occupancy has remained largely unchanged with 83.6% in 2022 and 83% in 2023 globally, this is compared with 81.4% occupancy prior to the pandemic. Shared office occupancy has remained stable at 70.5%, a small increase on 69% this year, which is above the level seen in our first Flexmark of 60.2%.
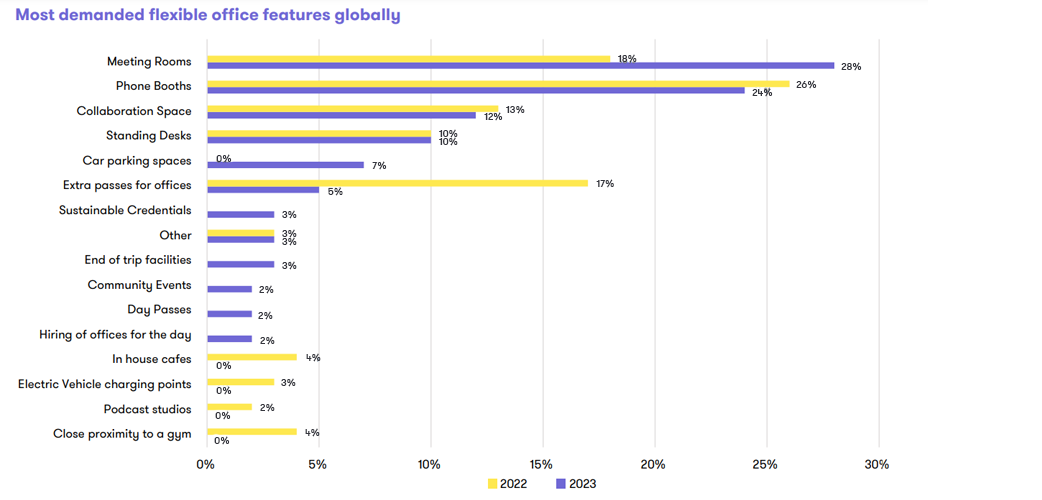
In 2023, meeting rooms overtook phone booths as the number one global demand of members acquiring space although both remain the top two demands of customers. In 2022 we saw significant demand for extra passes (17%) however this has reduced down to 5% in 2023.
Looking for a new office or want to list your office space for rent? Our team of experts are on hand to help.
All content © copyright 2024 Savills. All rights reserved. Savills Singapore Agency No.: L3009688B